A static HTML dashboard export is one downloadable .html file that packages a dashboard's layout, data snapshot, styles, and rendering code together. Juggle Dash creates that file from the draft you have edited, so it opens in a browser without a Juggle Dash server or account. The file's chart runtime loads ECharts from a CDN, which means an internet connection is required to render charts; the export is not a fully offline application.
What survives the export
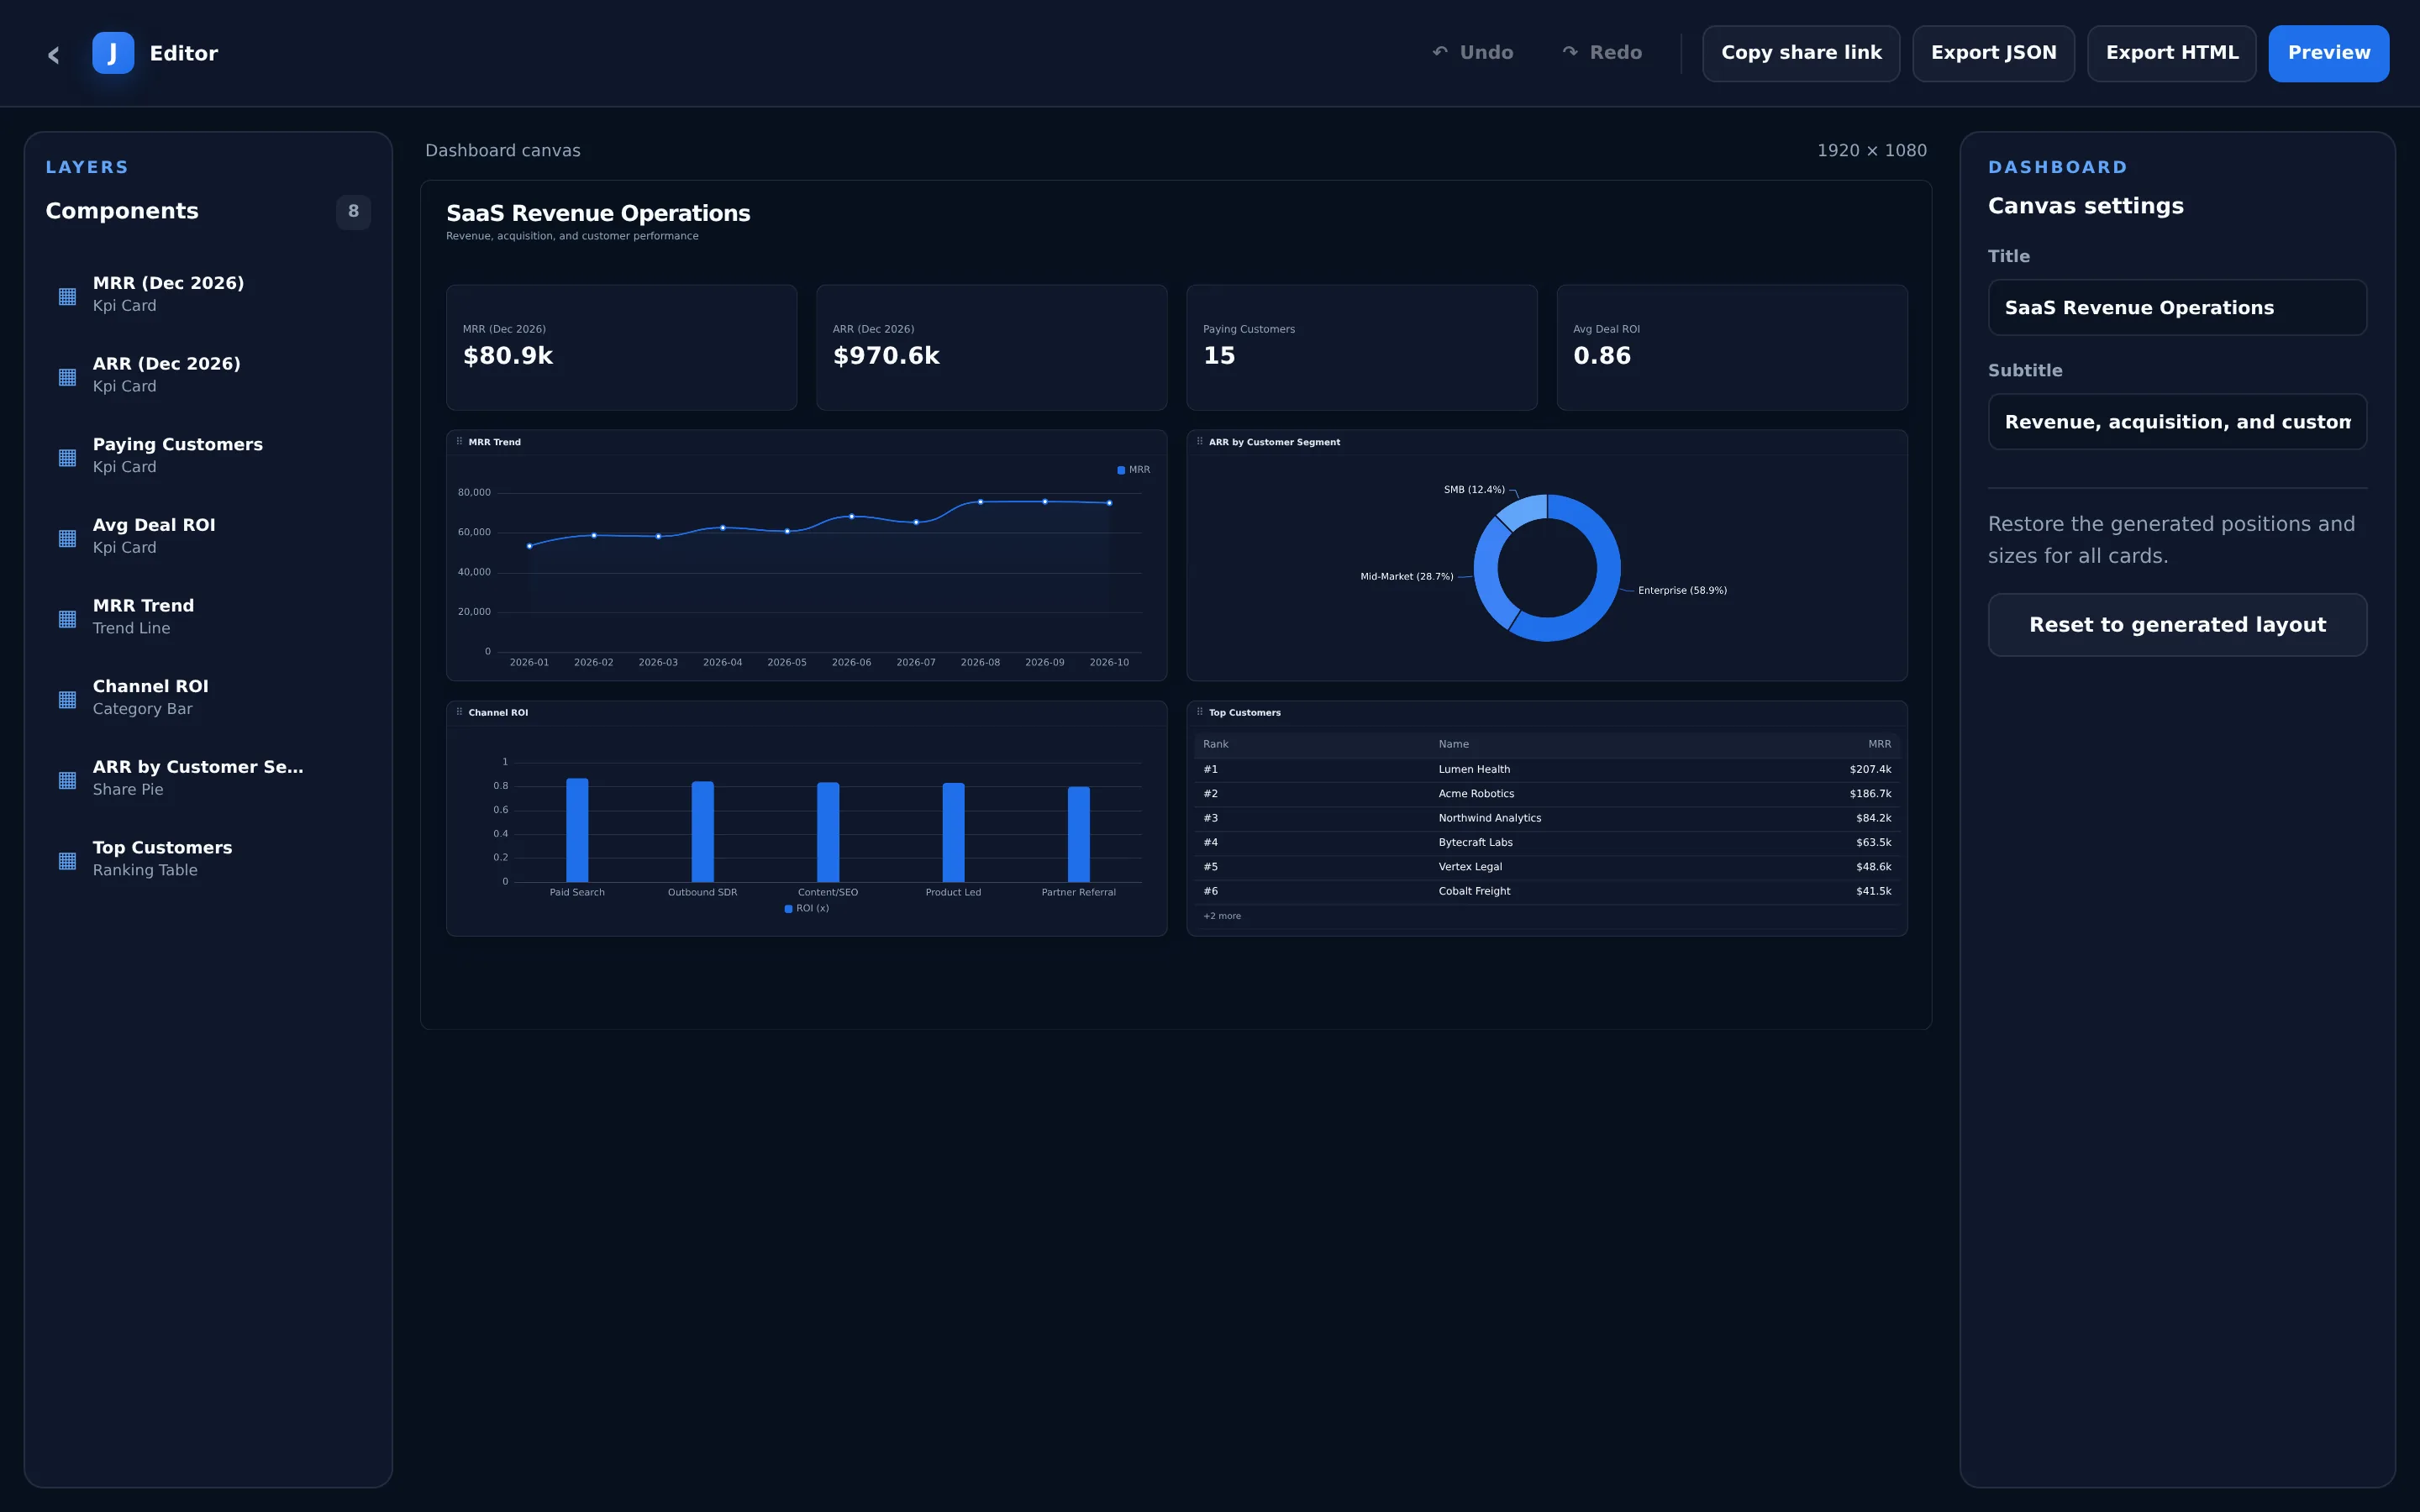
The exported file keeps the dashboard title and subtitle, panel arrangement, theme styling, KPI values, charts, tables, and the data embedded in the dashboard definition. For example, a saas_revenue_ops draft may include an MRR trend, channel ROI, ARR by segment, and a top-customer ranking. Those figures represent the data available when the dashboard was generated and exported.
That timing matters: the HTML is a snapshot, not a live connection. If the CSV changes next month, an existing file does not fetch the new rows. Create or update a draft from the new data and export again when you need a refreshed artifact.
What a static file does not do
An HTML export is not the editable Juggle Dash workspace. It does not update from a source file, connect to a database, or offer a permission system. It also does not preserve the editor's drag-and-drop controls or provide dashboard filter interactions. Treat it as a presentation and delivery artifact, not as a hosted analytics product.
Its portability also has a specific boundary: the dashboard and its data are in the file, but the chart library is loaded from cdn.jsdelivr.net. The source file is self-contained enough to pass around as one HTML document, while chart rendering still depends on access to that external runtime. An environment that blocks the CDN may not display charts.
How to export the dashboard
- Import CSV or JSON data and generate a dashboard draft from a prompt or an English preset.
- Review the draft and arrange or resize panels in the visual editor.
- Choose Export HTML to download the current dashboard as an HTML file.
- Open the downloaded file in a browser; its chart runtime loads ECharts from a CDN.
There is no build pipeline or server deployment step in this workflow. The downloaded file is a convenient handoff when the recipient needs to view a fixed dashboard and can access the chart runtime online.
Why use one HTML file?
A single document is easier to attach to an email, copy to removable storage, keep with a project folder, or open during a customer presentation than a dashboard that requires a Juggle Dash account. Because the layout and snapshot travel together, the viewer does not need your editor session. Still, follow your own data-handling rules before sharing a file that contains customer or revenue information.
The export embeds a Content Security Policy and runs its own dashboard rendering code. The policy permits the script source needed for ECharts, so this setup should not be described as having no external requests. It also does not add authentication or access control; anyone who has the file can inspect the data it contains.
Before sending an attachment or copying it to a shared drive, consider what the embedded rows reveal. A static dashboard is convenient precisely because the snapshot travels with the document, so it should be handled like the data source rather than like an empty presentation template. If the recipient cannot reach the chart CDN, include that connectivity requirement in your handoff notes or choose a different delivery approach suited to that environment.
HTML or JSON?
Choose HTML when the goal is to deliver or archive a view of the dashboard as it stands. Choose DSL JSON when you want a structured definition that is easier to inspect, review, and retain alongside other project files. Juggle Dash currently exports DSL JSON; it does not offer a JSON import-and-round-trip workflow, so keep the editable draft in the editor if you expect to make changes there. See the dashboard JSON format and its boundaries.
A CSV can be the starting point for either deliverable. The CSV-to-dashboard guide walks through import and editing before export.
How large is the example file?
The checked-in SaaS revenue operations HTML example is 99,144 bytes, about 97 KiB using 1 KiB = 1,024 bytes. This is a measurement of that specific example, not a promised maximum: dashboard data and chart options affect the output size. The ECharts runtime itself is fetched from the CDN rather than copied into the HTML, which is why the file can remain compact while still needing connectivity for chart rendering.
Make a file you can hand off
Import a CSV or JSON file, review the generated draft, and export the state you want someone else to see. Open the editor to try the workflow, or see pricing for the one-off export option.